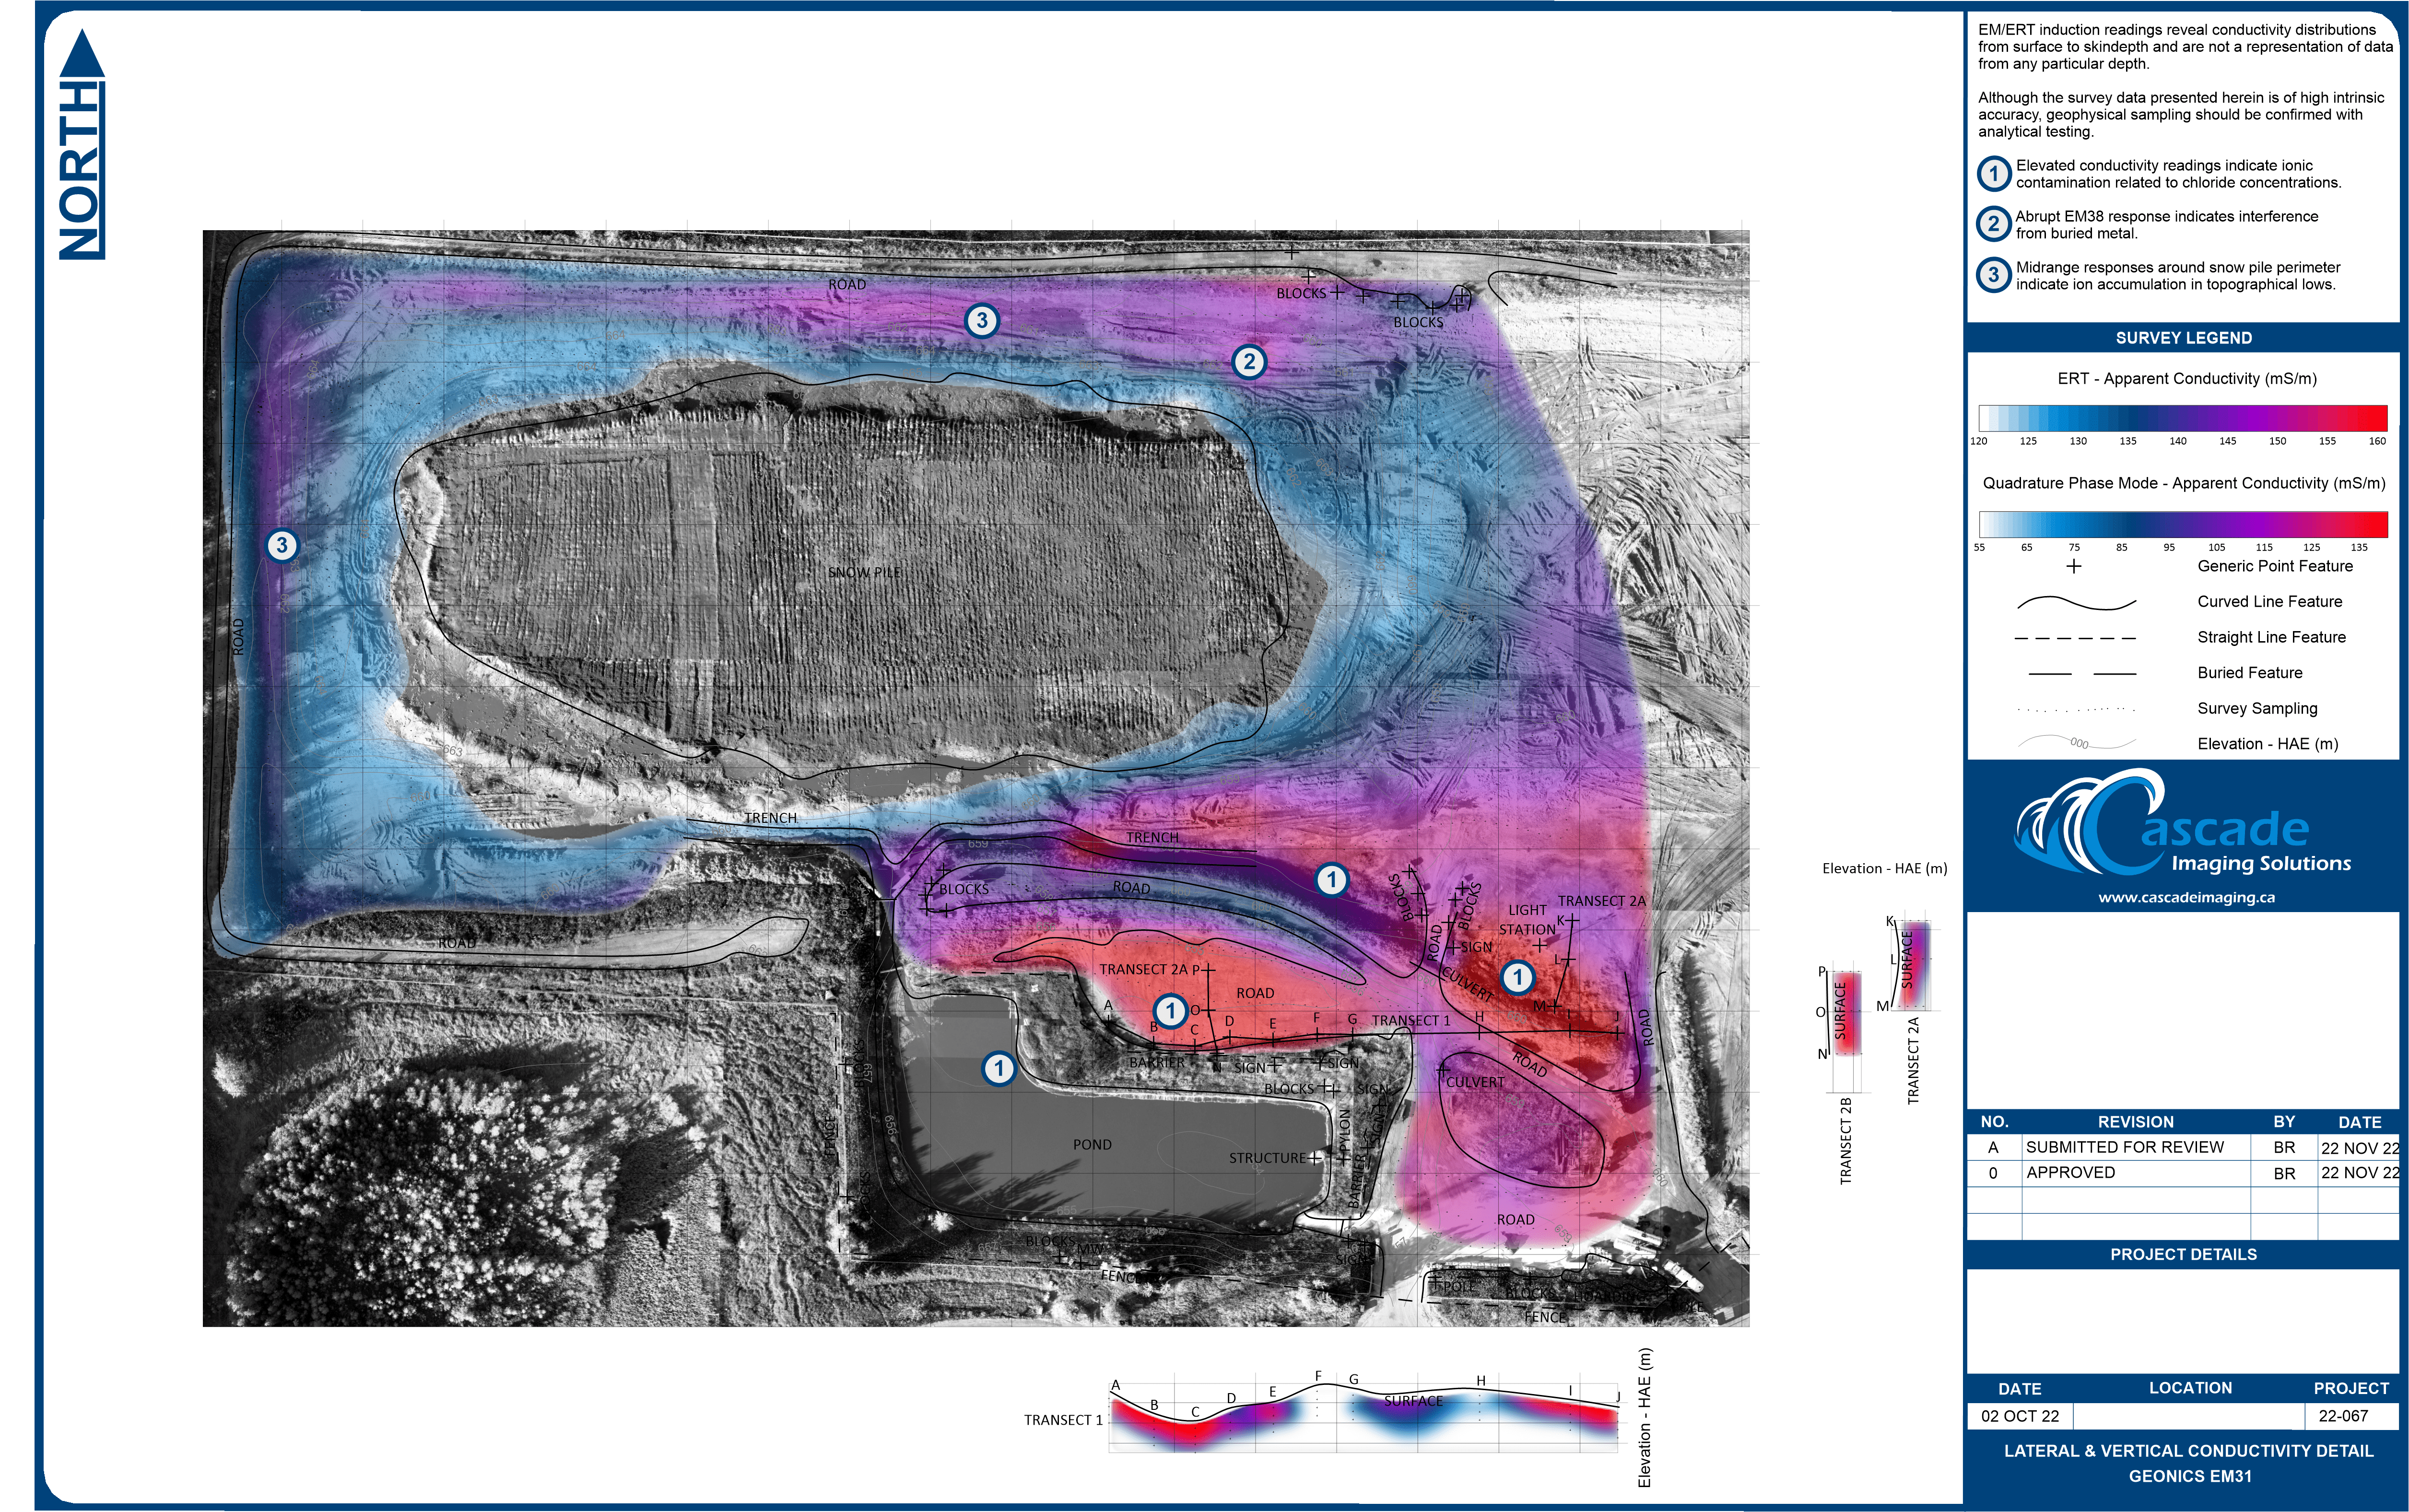
Surfer 软件 美国Golden Software 公司编制的一款以画三维图(等高线,image map, 3d surface)的软件。该软件简单易学,可以在几分钟内学会主要内容,且其自带的英文帮助(help菜单)对如何使用该软件解释的很详细,其中的tutorial教程更是清晰的介绍了surfer的简单应用。
Surfer 具有的强大插值功能和绘制图件能力,使它成为用来处理XYZ数据的首选软件,是地质工作者必备的专业成图软件。可以轻松制作基面图、数据点位图、分类数据图、等值线图、线框图、地形地貌图、趋势图、矢量图以及三维表面图等;提供11种数据网格化方法,包含几乎所有流行的数据统计计算方法;提供各种流行图形图像文件格式的输入输出接口以及各大GIS软件文件格式的输入输出接口,大大方便了文件和数据的交流和交换;提供新版的脚本编辑引擎,自动化功能得到极大加强。
Golden Software Surfer 是一款轮廓和3D表面映射程序。 它可以快速轻松地将您的数据转换为出色的轮廓,3D表面,3D线框,矢量,图像,阴影浮雕和贴图。 实际上,您可以自定义地图的所有方面,以准确生成您想要的演示文稿。 制作出版物质量地图从未如此简单快捷。
Surfer可让您完全控制所有地图参数。 您可以接受Surfer智能默认值以自动创建等高线图,或双击地图以轻松自定义地图要素。
在任何轮廓范围和轮廓间隔上显示轮廓图,或仅指定要在地图上显示的轮廓水平。 使用Surfer,您可以在轮廓之间添加颜色填充,以生成令人眼花缭乱的地图显示,或者为戏剧性的黑白打印输出生成灰度填充。
Golden Software Surfer 功能
- 新的“网格数据高级选项”对话框包括散点图,搜索椭圆和更易于使用的控件
- 可以沿着轮廓的弯曲路径绘制轮廓标签
- 生成相等的面积轮廓水平
- 新的色彩映射编辑器包括不透明度映射,通过直方图均衡或均匀分布的颜色拉伸,以及新的插值方法
- 在3D视图窗口中将贴图,分类的贴图和基础(矢量)图层显示为3D散点图
- 等高线图颜色比例尺可以显示轮廓等级的线条样式
- 格式化数字基本地图标签
- 阴影浮雕地图已与颜色浮雕地图结合使用
- 将几何属性添加到属性表
- 通过计算属性表中的属性来创建新属性或修改现有属性
- 克里金网格化方法现在支持克里金与外部漂移
- 使用“轮廓”命令或“地图向导”中的“网格数据”,“马赛克”,“网格”创建新网格时,从现有网格复制网格几何体
- 使用命令或在“内容”窗口中拖放要素,将要素移动或复制到不同的基础图层
- 执行地理处理命令:线条细化,线条平滑,缓冲,创建交叉点,更改类型,连接折线,联合,相交或多边形的差异,断开折线,在交叉点处断开折线,组合岛屿/湖泊以及拆分岛屿/湖泊

Surfer
Explore the depths of your data.
Visualize Data
You work hard gathering your data. Don’t settle for subpar visualization. Utilize Surfer’s extensive modeling tools to display your data the way it deserves while maintaining accuracy and precision. Clearly communicate information with Surfer.
Analyze Data
Discover the depths of your data with Surfer’s numerous analysis tools. Adjust interpolation and gridding parameters, assess the spatial continuity of data with variograms, define faults and breaklines, or perform grid calculations such as volumes, transformations, smoothing, or filtering. Surfer quickly transforms your data into knowledge.
Communicate Results
Communicate your hard-earned findings with confidence. Whether it is for your project manager, thesis advisor, or client, Surfer facilitates a complete and thorough understanding of data.
Trusted Since 1983
Surfer has withstood the tests of time. See for yourself why thousands of scientists and engineers across the globe trust Surfer to display their data.
Feather
Create Professional Maps
Easily communicate both simple and complex spatial data. Surfer gives you the tools to create high-quality maps to clearly deliver your message to coworkers, clients, and stakeholders.
Surfer Map Types
|
|
Model Data in Multi-Dimensions
Gain deeper insights into your data when viewed in three-dimensional space. Surfer’s 3D viewer makes it easy to model, analyze, and understand all aspects of your data. Switching between Surfer’s 2D and 3D perspectives ensures you discover all of your data’s patterns and trends.
Achieve a 360⁰ Perspective
|
LiDAR Point Clouds
LiDAR is an increasingly popular data collection method used within many fields including archaeology, surveying, GIS, and more. Use Surfer’s extensive LiDAR processing and visualization features to take advantage of all that LiDAR has to offer.
Surfer’s LiDAR Point Cloud Features
|
|
Surfer’s LAS/LAZ Filtering Options
|
Streamlined Workflows
You will be up and running in matter of minutes. Surfer’s user interface was designed to take the guesswork out of learning a new program. We worked hard to streamline workflows so you don’t have to.
Surfer User Interface Features
|
|
Enhance Maps & Models
Surfer gives you the tools to visualize and model all types of data, but it doesn’t stop there. Surfer’s extensive customization options allow you to convey complex ideas in an easy to understand manner. Enhance your maps and models with a variety of customizations options.
Surfer Customization Options
|
|
Full Grid Control
Surfer gives you extensive control over grid files. Create isopach maps for structural geology, calculate volumes for inventory management or derivatives for terrain analysis, and even create site suitability models all with grid files. Achieve a complete understanding of your underlying data.
Surfer Grid Features
|
|
Edit Contours
Edit contour lines down to the finest detail. Surfer’s grid editor lets you quickly adjust contour lines by interactively editing the underlying grid file. Brush, warp, smooth, push down or up, and erase grid nodes, and immediately see the changes to your grid-based maps.
|
|
Grid Data with Certainty
Have complete confidence in the accuracy of your model. Surfer provides numerous interpolation methods to grid regularly or irregularly spaced data onto a grid or raster, and each interpolation method provides complete control over gridding parameters. Plus, no time is wasted with multithreaded gridding!
Surfer Gridding Methods
|
|
Surfer Interpolation Features
|
|
Make Meaningful Decisions
Get answers to your questions with Surfer’s geoprocessing tools. Process your data and analyze relationships. Narrow down areas of interest, highlight important intersections, or perform mathematical calculations on the underlying data to make informed decisions.
Surfer Geoprocessing Tools
|
|
Surfer Symbology
|
Immediate Access to Online Data
An abundance of data is at your fingertips waiting to be visualized. Surfer gives you immediate access to worldwide aerial imagery, Open Street Map imagery, worldwide vector data, and terrain data. If you have your own favorite data servers or access to a private data server, include a custom link to that source for easy access. Surfer makes it easy to access the surplus of online data.
Supported server types:
- Web mapping server (WMS)
- Open Street Map server (OSM)
- Web coverage server (WCS)
- Web feature server (WFS)
Work Seamlessly with all Coordinate Systems
Your job is to transform data into valuable visualizations. Surfer’s job is to make it easy for you. Surfer effortlessly manages unreferenced data and data projected in different/multiple coordinate systems. It really is that easy.
Surfer Coordinate System Features
|
|
Complete Compatibility
Seamlessly visualize and analyze data from multiple sources. Surfer natively reads numerous file formats including SHP, DXF, and XLSX. Surfer also supports all popular export formats. An extensive set of data management tools are at your disposal for complete compatibility.
Collaborate with Confidence
Quickly share your work with colleagues, stakeholders, and clients. Surfer models are ready for printed publication with the high quality export formats including PDF or TIF. Alternatively, share your work online with web compatible formats like JPG or PNG. If you are preparing for a presentation, simply copy and paste your map or model into presentation tools such as Microsoft PowerPoint or Word.
Home Page: https://www.goldensoftware.com/products/surfer
下载地址
三维立体绘图 Golden Software Surfer v25.2.259 Win64
夸克云盘:https://pan.quark.cn/s/be12ae967dae
百度网盘:https://pan.baidu.com/s/1QDyODW9uDZ5v8Aatxo2Bmw?pwd=98vq
123云盘:https://www.123pan.com/s/PjcA-HgNRA.html
 落尘之木
落尘之木


![[聊天软件] [更新]PC版微信3.9.x防撤回可编辑|多开|去只读|通用补丁-落尘之木](https://img.luochenzhimu.com/public/2018/12/2018123010.png)


![Windows 11 正式发行版 [官方 MVS(MSDN)][Windows 11 NI-23H2] 2024年2月 映像更新-落尘之木](https://img.luochenzhimu.com/public/2021/10/2021100515.jpg)


感谢落尘之木!太棒了!