 落尘之木
落尘之木GraphPad Prism 集生物统计、曲线拟合和科技绘图于一体,其所具有的功能均非常实用和精炼,包括了一些特色的功能,如ROC曲线分析、Bland-Altman分析等;曲线拟合功能是GraphPad Prism超越其他统计软体的制胜法宝,GraphPad Prism的线性/非线性拟合功能使用操作极其方便,不仅内置了常见的回归模型,还专门内置了Aadvanced Rradioligand Bbinding, Bacterial Growth, 剂量反映曲线,峰拟合等数十个生物统计模组,GraphPad Prism的绘图功能也很具特色,无需专门绘製统计图形,只要输入资料,图表自动生成且随资料改变及时更新,非常方便实用。
能进行自定义方程曲线拟合的软体中,GraphPad Prism的操作最为简便快捷,拟合前参数设置方便,拟合速度快,并支援批量拟合,这在同类软体中非常少见,可以说GraphPad Prism当之无愧为非线性拟合的高手。
Prism 在科学图表的绘制方面可以视为Sigmaplot的替代软体,但是却又包含了简单的试算表,可以直接输入原始数据,软体自动计算标准差和p value,此外,也包含了其他几项数值分析的能力。
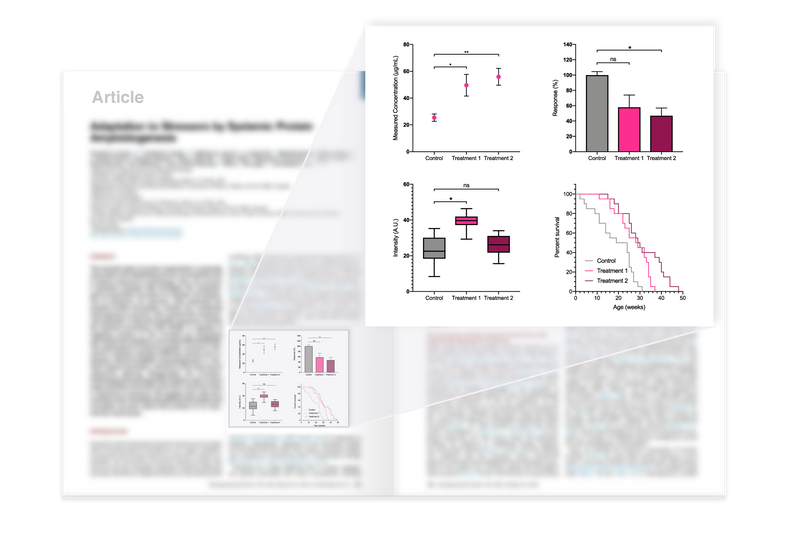
Prism 8 Analyze, graph and present your scientific work.
The preferred analysis and graphing solution purpose-built for scientific research. Join the world’s leading scientists and discover how you can use Prism to save time, make more appropriate analysis choices, and elegantly graph and present your scientific research.
Comprehensive Analysis and Powerful Statistics, Simplified
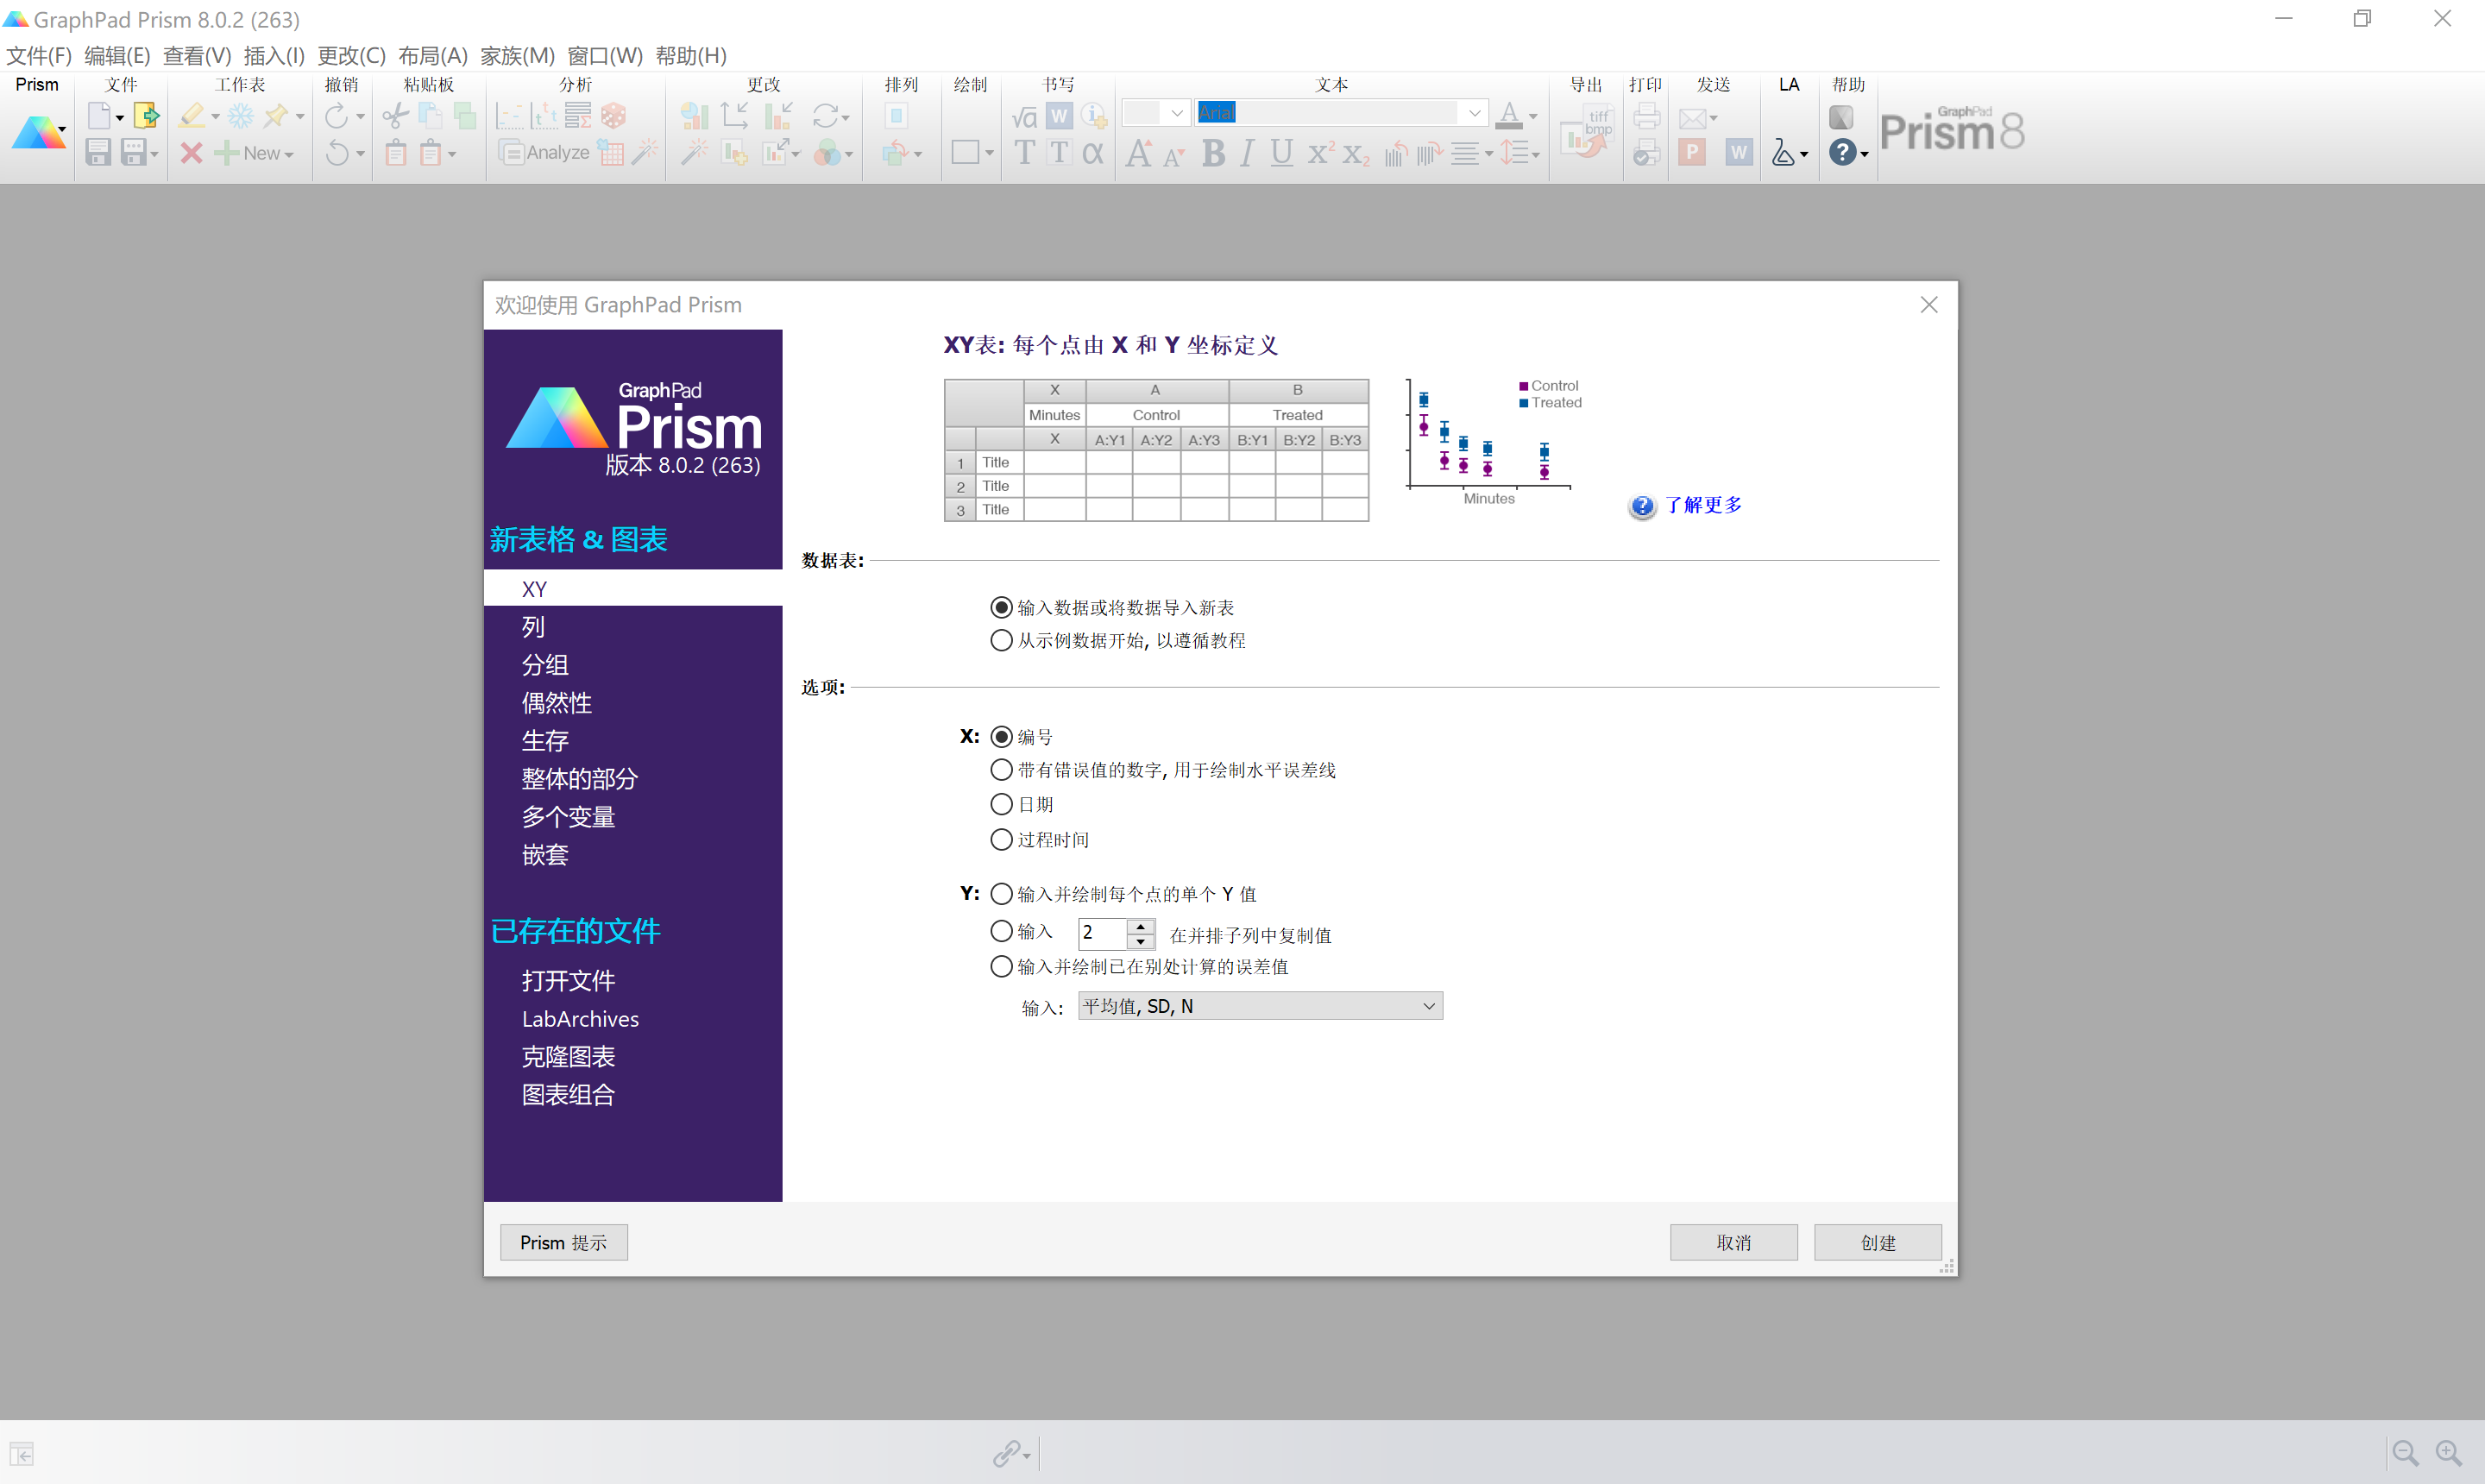
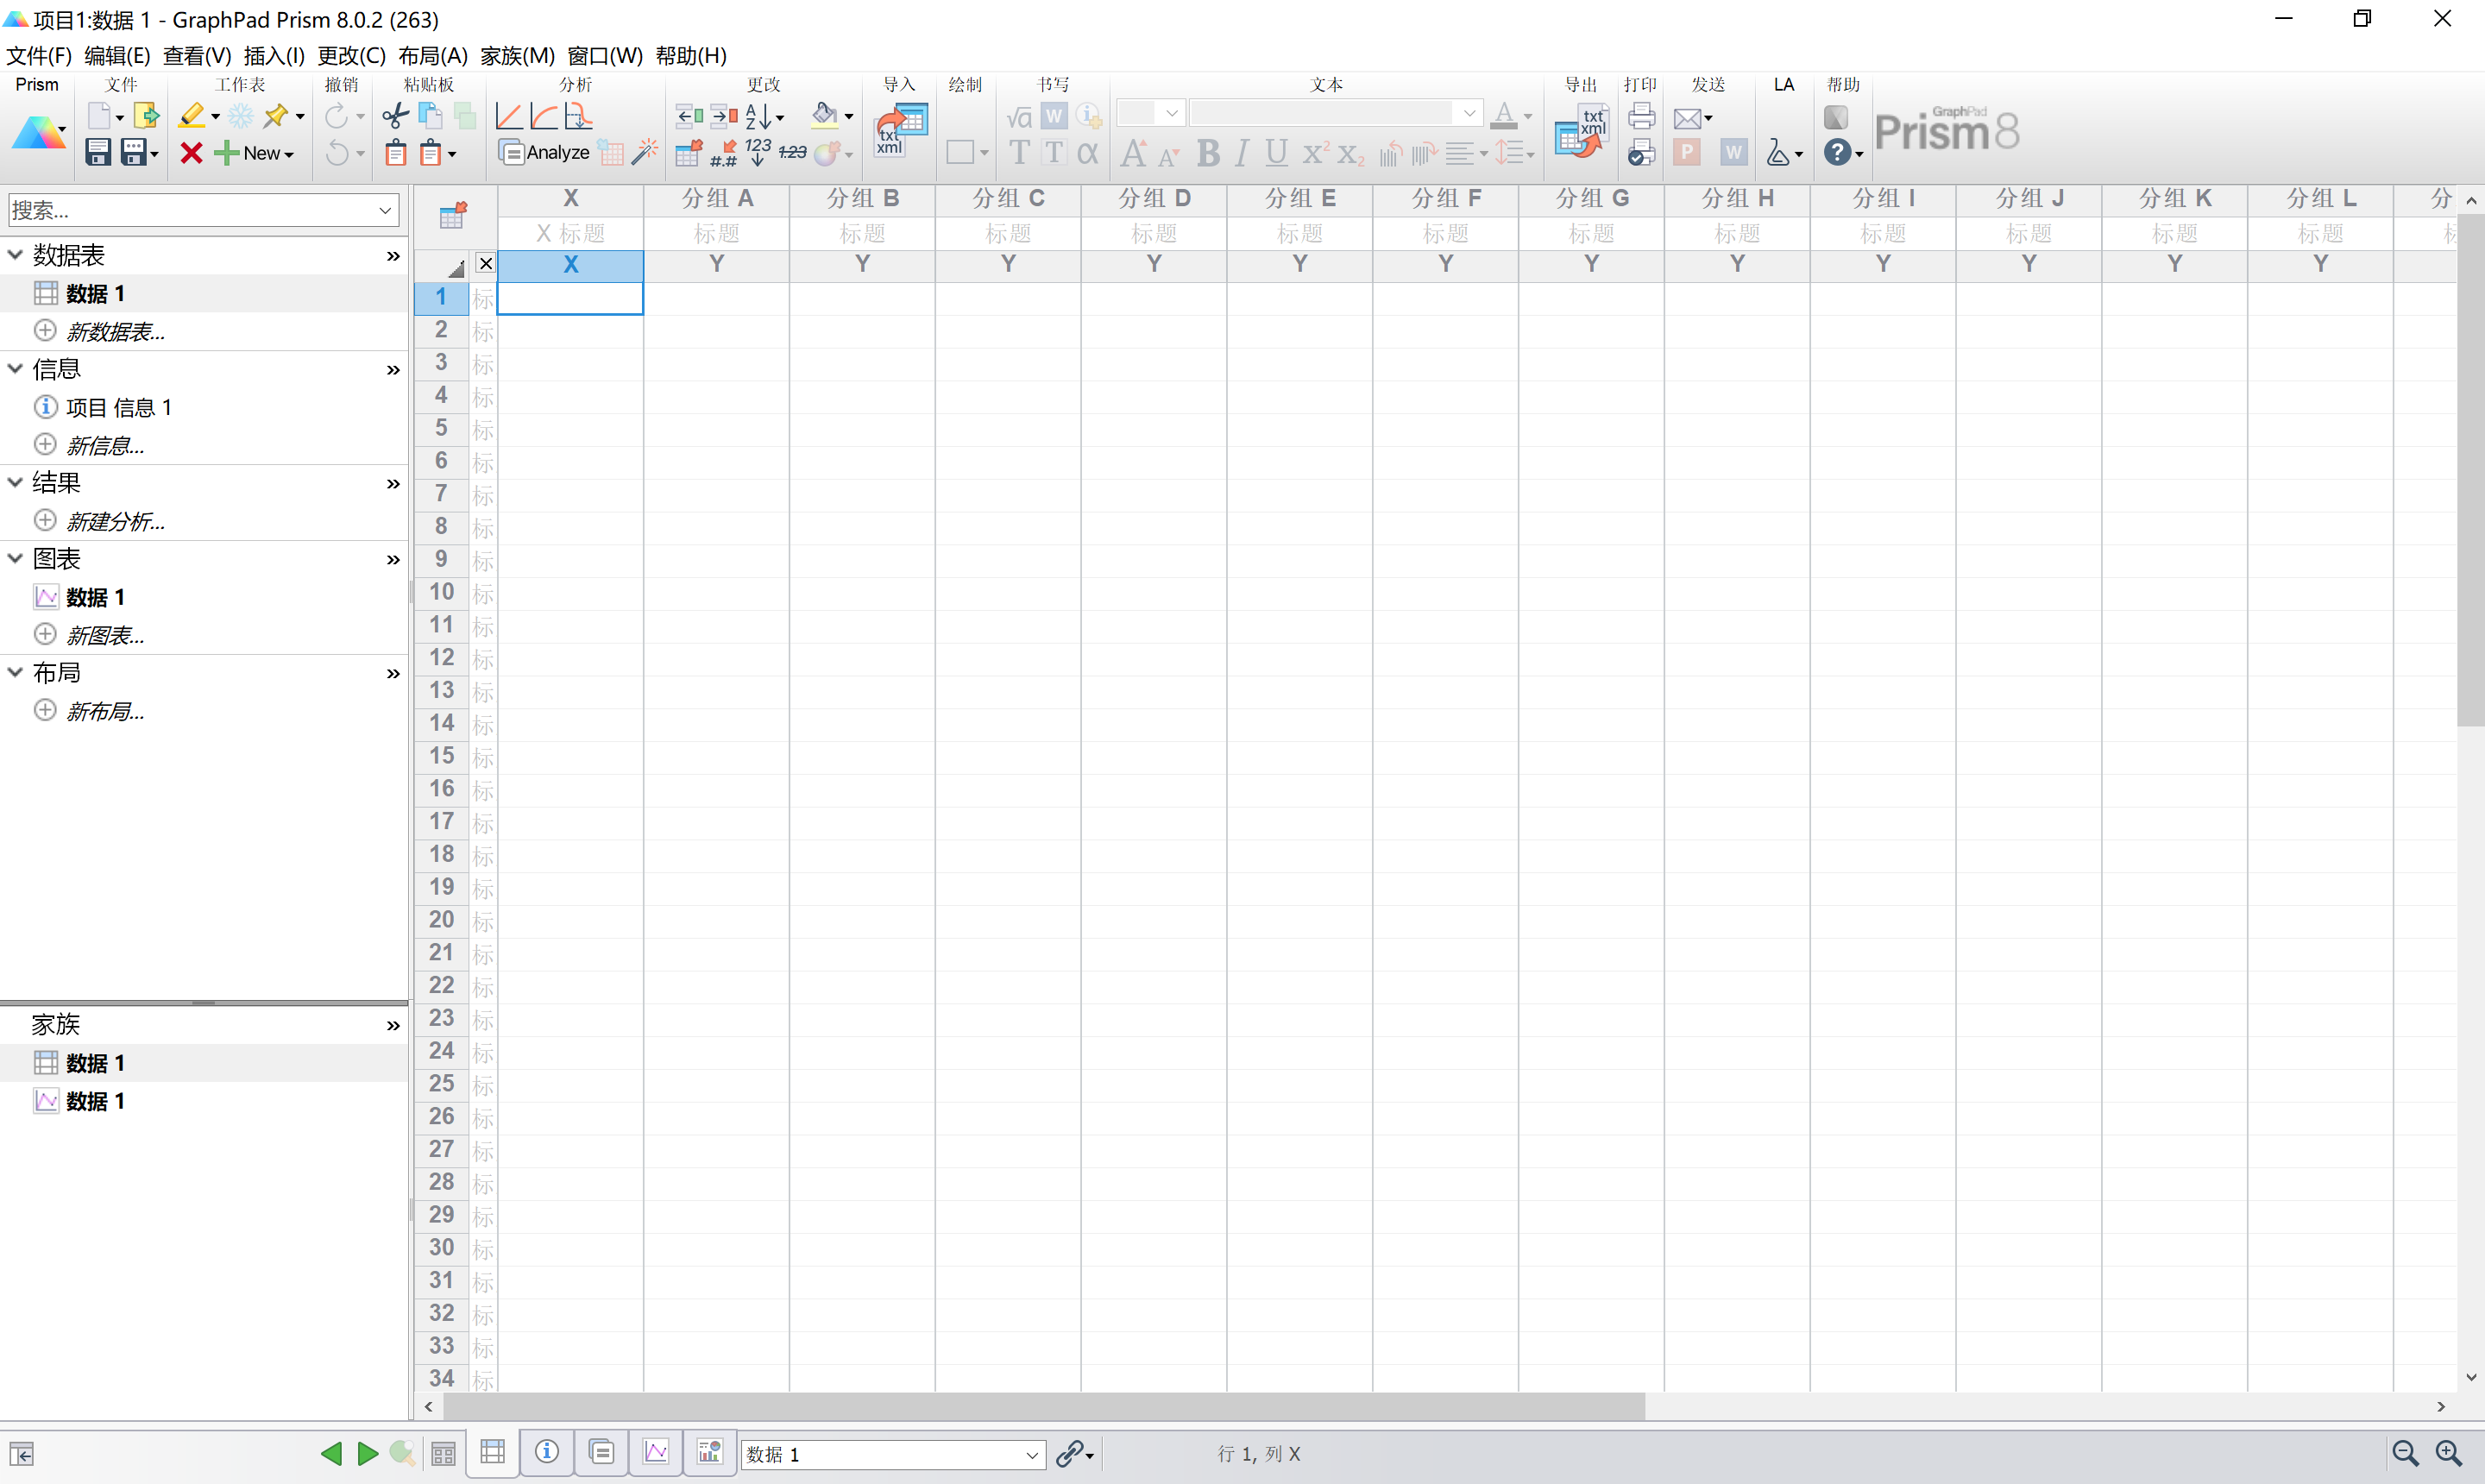
Organize Your Data Effectively
Unlike spreadsheets or other scientific graphing programs, Prism has eight different types of data tables specifically formatted for the analyses you want to run. This makes it easier to enter data correctly, choose suitable analyses, and create stunning graphs.

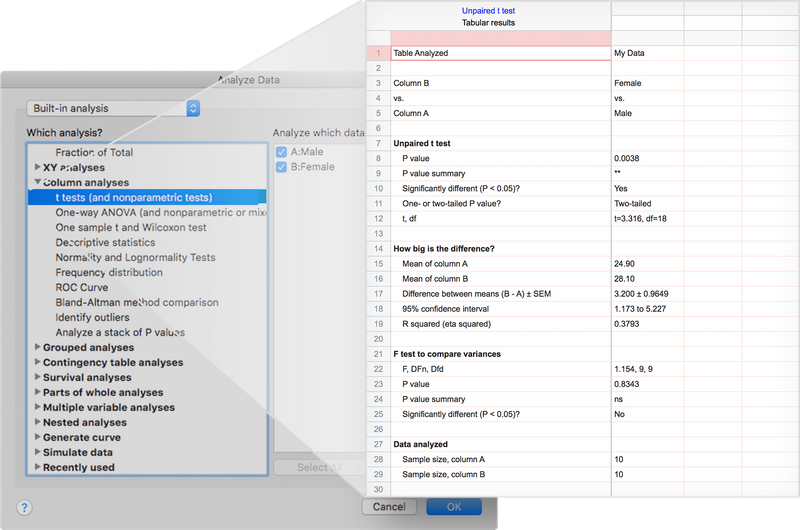
Perform The Right Analysis
Avoid statistical jargon. In clear language, Prism presents an extensive library of analyses from common to highly specific—nonlinear regression, t tests, nonparametric comparisons, one-, two- and three-way ANOVA, analysis of contingency tables, survival analysis, and much more. Each analysis has a checklist to help you understand the required statistical assumptions and confirm you have selected an appropriate test.
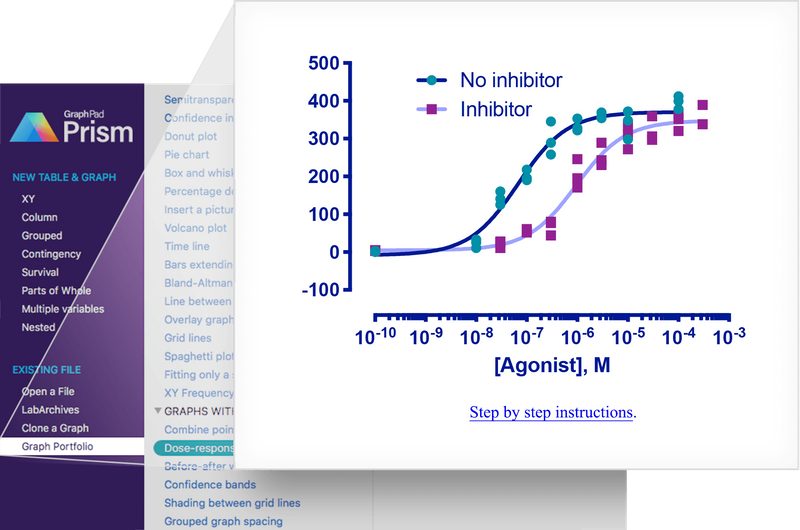
Get Actionable Help As You Go
Reduce the complexity of statistics. Prism’s online help goes beyond your expectations. At almost every step, access thousands of pages from the online Prism Guides. Browse the Graph Portfolio and learn how to make a wide range of graph types. Tutorial data sets also help you understand why you should perform certain analyses and how to interpret your results.
Work Smarter, Not Harder
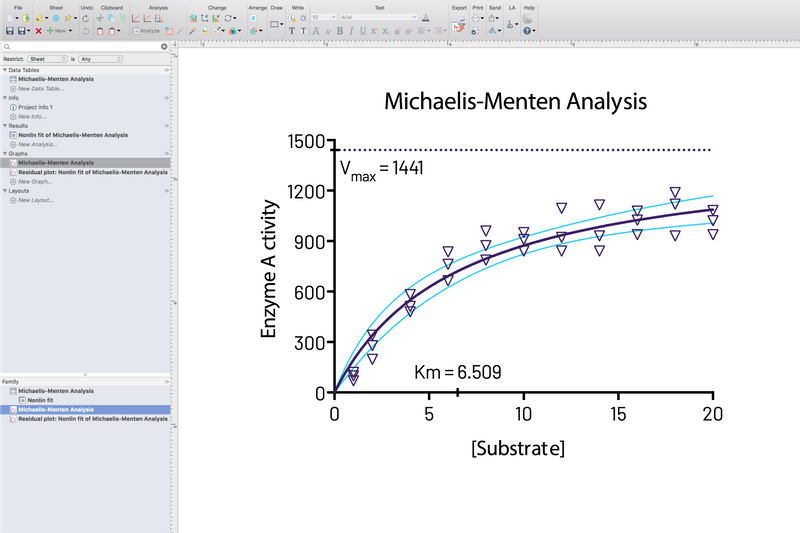
One-Click Regression Analysis
No other program simplifies curve fitting like Prism. Select an equation and Prism does the rest—fits the curve, displays a table of results and function parameters, draws the curve on the graph, and interpolates unknown values.
Focus on Your Research, Not Your Software
No coding required. Graphs and results are automatically updated in real time. Any changes to the data and analyses—adding missed data, omitting erroneous data, correcting typos, or changing analysis choices—are reflected in results, graphs, and layouts instantaneously.
Automate Your Work Without Programming
Reduce tedious steps to analyze and graph a set of experiments. It is easy to replicate your work by creating a template, duplicating a family, or cloning a graph—saving you hours of set up time. Apply a consistent look to a set of graphs with one click using Prism Magic.
The Fastest Way to Elegantly Graph and Share Your Work
Countless Ways to Customize Your Graphs
Focus on the story in your data, not manipulating your software. Prism makes it easy to create the graphs you want. Choose the type of graph, and customize any part—how the data is arranged, the style of your data points, labels, fonts, colors, and much more. The customization options are endless.
Export Publication-Quality Graphs With One Click
Reduce time to publish. Prism allows you to customize your exports (file type, resolution, transparency, dimensions, color space RGB/CMYK) to meet the requirements of journals. Set your defaults to save time.
Enhance Collaboration
Share more than your graphs. Prism’s comprehensive record of your data enables effective collaboration with other scientists. All parts of your Prism project (raw data, analyses, results, graphs, and layouts) are contained in a single file that you can share with one click. Now others can easily follow your work at every step, enhancing the clarity of your findings and streamlining your collaborative efforts.

Discover What’s New in Prism 8!
Introducing an even more powerful Prism featuring enhanced data visualization and graph customization, more intuitive navigation, and more sophisticated statistical analyses.
Enhanced Data Visualization
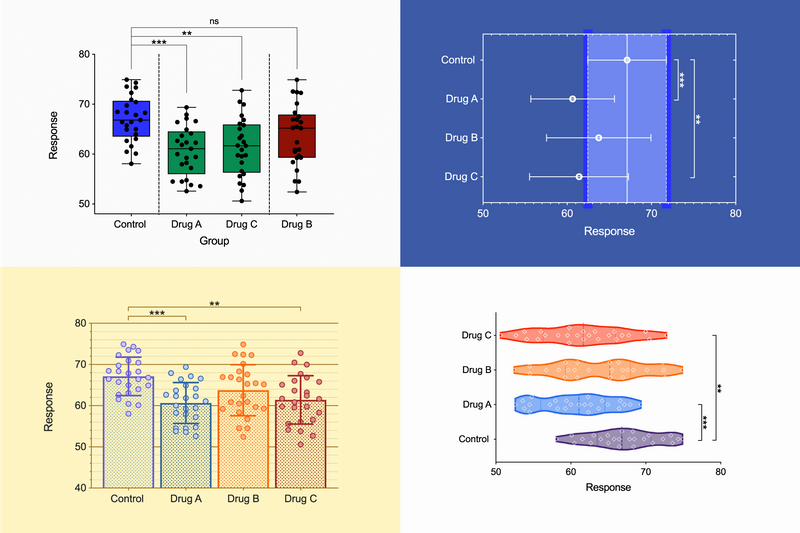
Violin plots
Visualize distributions of large data sets more clearly than with box-whisker or simple bar graphs
Subcolumn graphs
Organize related subsets of nested data in a single graph
Smoothing spline
Major improvements in showing general data trends through Akima splines and smoothing splines with improved control over the number of knots, or inflection points
No more smiles
More intelligent adjustments of data point positions in scatter plots for better looking graphs
Improved Graphing and Customization Options
Draw lines and brackets with centered text
Easily annotate your data with asterisks or custom labels
Automatically label bar graphs
Annotate your bar graphs with values for the means, medians, or sample sizes to emphasize what’s important in your work
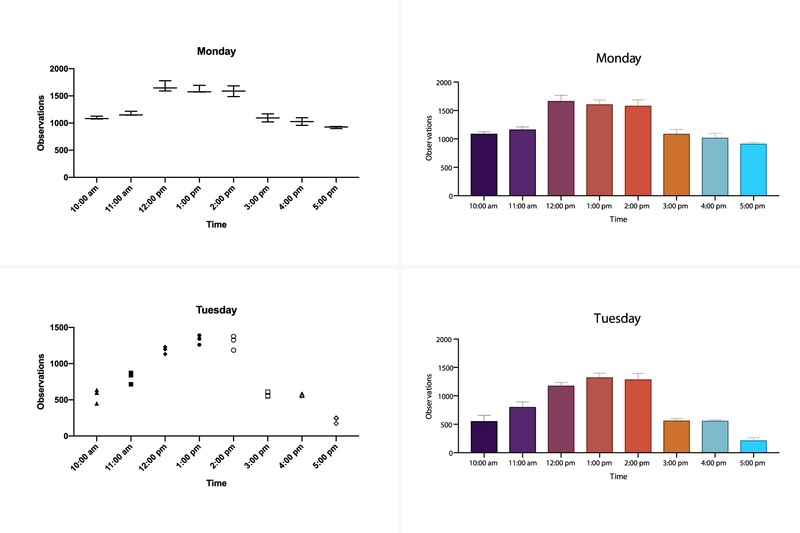
Improved grouped graphs
Easily create graphs that show both individual points (scatter) along with bars for mean (or median) and error bars
More Intuitive Navigation
Find related sheets easily
New family panel shows the family of sheets related to the current sheet, and chains of analyses are automatically indented
Easily navigate between multiple results tables
Analyses with multiple results tables now grouped into a single sheet with tabs for each result table; choose which tabs to show or hide
Improved Search
Search by sheets with highlights or notes of specified color
Now Featuring Eight Kinds of Data Tables
New: Multiple variables data table
Each row represents a different subject and each column is a different variable, allowing you to perform Multiple linear regression (including Poisson regression), extract subsets of data into other table types, or select and transform subsets of the data
New: Nested data table
Analyze and visualize data that contains subsets within related groups; Perform nested t tests and nested one-way ANOVA using data within these tables
More Sophisticated Statistical Analyses
Perform repeated measures ANOVA – even with missing data
Now Prism will automatically fit a mixed effects model to complete this analysis
Powerful Improvements in regular ANOVA
View cell, row, column, and grand means (or least square means when data is missing); test for homogeneity of variance. For one-way ANOVA, choose a test that does not assume homogeneous variances.
Nested t test and nested one-way ANOVA
Utilize new types of data tables to perform nested t-tests and nested ANOVA as well as multiple linear regression (including Poisson regression)
Graph residuals from multiple types of analyses
Test residuals for normality in four different ways, and choose from four different ways to display these residuals
Discover the Breadth of Statistical Features Available in Prism 8
Statistical Comparisons
- Paired or unpaired t tests. Reports P values and confidence intervals.
- Automatically generate volcano plot (difference vs. P value) from multiple t test analysis.
- Nonparametric Mann-Whitney test, including confidence interval of difference of medians.
- Kolmogorov-Smirnov test to compare two groups.
- Wilcoxon test with confidence interval of median.
- Perform many t tests at once, using False Discovery Rate (or Bonferroni multiple comparisons) to choose which comparisons are discoveries to study further.
- Ordinary or repeated measures ANOVA followed by the Tukey, Newman-Keuls, Dunnett, Bonferroni or Holm-Sidak multiple comparison tests, the post-test for trend, or Fisher’s Least Significant tests.
- One-way ANOVA without assuming populations with equal standard deviations using Brown-Forsythe and Welch ANOVA, followed by appropriate comparisons tests (Games-Howell, Tamhane T2, Dunnett T3)
- Many multiple comparisons test are accompanied by confidence intervals and multiplicity adjusted P values.
- Greenhouse-Geisser correction so repeated measures one-, two-, and three-way ANOVA do not have to assume sphericity. When this is chosen, multiple comparison tests also do not assume sphericity.
- Kruskal-Wallis or Friedman nonparametric one-way ANOVA with Dunn’s post test.
- Fisher’s exact test or the chi-square test. Calculate the relative risk and odds ratio with confidence intervals.
- Two-way ANOVA, even with missing values with some post tests.
- Two-way ANOVA, with repeated measures in one or both factors. Tukey, Newman-Keuls, Dunnett, Bonferroni, Holm-Sidak, or Fisher’s LSD multiple comparisons testing main and simple effects.
- Three-way ANOVA (limited to two levels in two of the factors, and any number of levels in the third).
- Analysis of repeated measures data (one-, two-, and three-way) using a mixed effects model (similar to repeated measures ANOVA, but capable of handling missing data).
- Kaplan-Meier survival analysis. Compare curves with the log-rank test (including test for trend).
- Comparison of data from nested data tables using nested t test or nested one-way ANOVA (using mixed effects model).
Nonlinear Regression
- Fit one of our 105 built-in equations, or enter your own. Now including family of growth equations: exponential growth, exponential plateau, Gompertz, logistic, and beta (growth and then decay).
- Enter differential or implicit equations.
- Enter different equations for different data sets.
- Global nonlinear regression – share parameters between data sets.
- Robust nonlinear regression.
- Automatic outlier identification or elimination.
- Compare models using extra sum-of-squares F test or AICc.
- Compare parameters between data sets.
- Apply constraints.
- Differentially weight points by several methods and assess how well your weighting method worked.
- Accept automatic initial estimated values or enter your own.
- Automatically graph curve over specified range of X values.
- Quantify precision of fits with SE or CI of parameters. Confidence intervals can be symmetrical (as is traditional) or asymmetrical (which is more accurate).
- Quantify symmetry of imprecision with Hougaard’s skewness.
- Plot confidence or prediction bands.
- Test normality of residuals.
- Runs or replicates test of adequacy of model.
- Report the covariance matrix or set of dependencies.
- Easily interpolate points from the best fit curve.
- Fit straight lines to two data sets and determine the intersection point and both slopes.
Column Statistics
- Calculate descriptive statistics: min, max, quartiles, mean, SD, SEM, CI, CV, skewness, kurtosis.
- Mean or geometric mean with confidence intervals.
- Frequency distributions (bin to histogram), including cumulative histograms.
- Normality testing by four methods (new: Anderson-Darling).
- Lognormality test and likelihood of sampling from normal (Gaussian) vs. lognormal distribution.
- Create QQ Plot as part of normality testing.
- One sample t test or Wilcoxon test to compare the column mean (or median) with a theoretical value.
- Identify outliers using Grubbs or ROUT method.
- Analyze a stack of P values, using Bonferroni multiple comparisons or the FDR approach to identify “significant” findings or discoveries.
Linear Regression and Correlation
- Calculate slope and intercept with confidence intervals
- Force the regression line through a specified point.
- Fit to replicate Y values or mean Y.
- Test for departure from linearity with a runs test.
- Calculate and graph residuals in four different ways (including QQ plot).
- Compare slopes and intercepts of two or more regression lines.
- Interpolate new points along the standard curve.
- Pearson or Spearman (nonparametric) correlation.
- Multiple linear regression (including Poisson regression) using the new multiple variables data table.
Clinical (Diagnostic) Lab Statistics
- Bland-Altman plots.
- Receiver operator characteristic (ROC) curves.
- Deming regression (type ll linear regression).
Simulations
- Simulate XY, Column or Contingency tables.
- Repeat analyses of simulated data as a Monte-Carlo analysis.
- Plot functions from equations you select or enter and parameter values you choose.
Other Calculations
- Area under the curve, with confidence interval.
- Transform data.
- Normalize.
- Identify outliers.
- Normality tests.
- Transpose tables.
- Subtract baseline (and combine columns).
- Compute each value as a fraction of its row, column or grand total.
Home Page: https://www.graphpad.com
下载地址
科学制图 GraphPad Prism 8官方最新版下载:
Windows 64 Bit: https://cdn.graphpad.com/downloads/prism/8/InstallPrism8-64bit.msi
Windows 32 Bit: https://cdn.graphpad.com/downloads/prism/8/InstallPrism8-32bit.msi
macOS: https://cdn.graphpad.com/downloads/prism/8/InstallPrism8.dmg
科学制图 GraphPad Prism 8.0.2.263 Windows x86 x64 简体中文汉化
落尘之木原创汉化,2019.12.16
落尘之木:https://dl.luochenzhimu.com/software/Prism/GraphPad_Prism_8.0.2.263_x86_x64_Win_zh_CN.zip
百度网盘:https://pan.baidu.com/s/1ck4sYsIE6LeogJq8Ihkuyg
科学制图 GraphPad Prism 8.0.2.263 Windows x86 x64
百度网盘:https://pan.baidu.com/s/1NHM4rjHxAyttN5KscYgf7g


请问serial number 填什么啊
NB
汉化了汉化了,大佬威武
总算汉化出来了
终于回来拉!!!!
最新的到了8.2.1了,请问有汉化的嘛
好久不上线了啊。